It’s a great feature available in Visual Studio 2010 Ultimate to speed up debugging process. Using IntelliTrace we can record debug information and then we can move backwards and forwards to review the debug session.
If we want to find an exception we may have to put several breakpoints in our code. When debugger hits breakpoint, application gets paused and then developer can start tracing. Here at this point developer can view the state of the application, local variables and call stack. We may have to restart the application couple of times to reach that line where exception occurs. This approach could be tedious. IntelliTrace helps us in this regards. IntelliTrace starts collecting the data as soon as debugging session gets started and it stores collected information in a file with .iTrace extension, which we can use for reviewing the session.
IntelliTrace extends and enhances the Visual Studio live debugging experience that we are used to. We still have access to all the Visual Studio debugger features that we are familiar with. IntelliTrace operates invisibly in the background, recording debug information. When we want to look back at a past state of our application, we can start IntelliTrace mode. In this mode, we can navigate to backwards as well as forwards to various points.
Enabling IntelliTrace mode
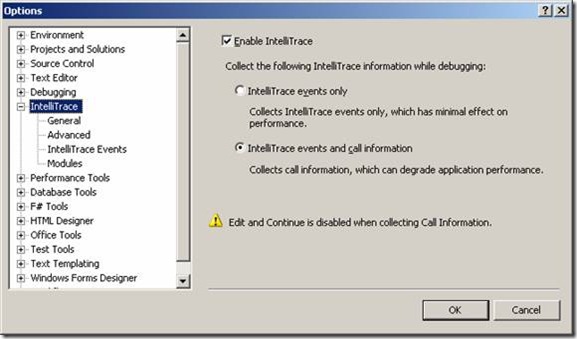
Go to Tools-> Options -> InelliTrace -> Check “Enable IntelliTrace†checkbox.
There are two ways to capture debug information using IntelliTrace.
- IntelliTrace events only.
- IntelliTrace events and call information.
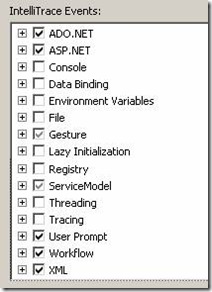
IntelliTrace events only – This is a default option. When this option is selected it will capture only specific events which occur in our application such as threading, Registry, database activities etc.
You can find whole list of events by clicking IntelliTrace Events sub node of IntelliTrace node.
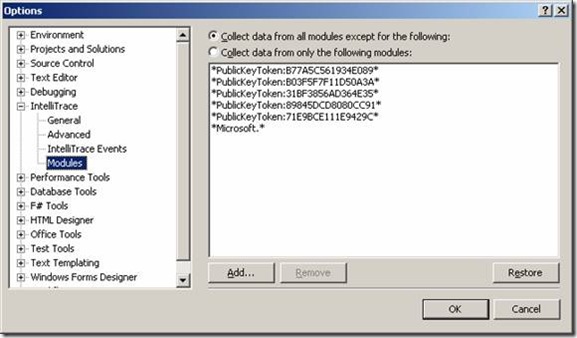
IntelliTrace events and call information – When this option is selected, IntelliTrace starts collecting the information of each method calls and event in our application. In modules sub node of IntelliTrace node, we can specify those modules which we do not want to debug. IntelliTrace will not collect debug information for those modules.
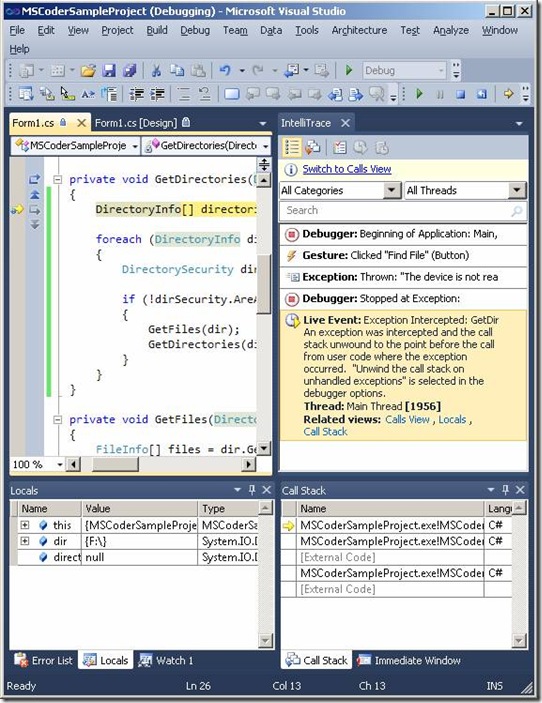
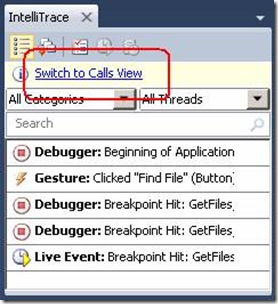
Let’s start the debugging and see the IntelliTrace window how does it look like. By default events view will be available as shown in below image.
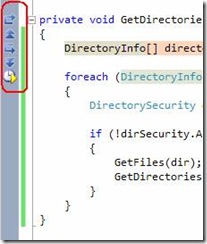
Here in IntelliTrace window, we can see all the events occurred in the application. We can navigate backwards and forwards by using navigation symbols.
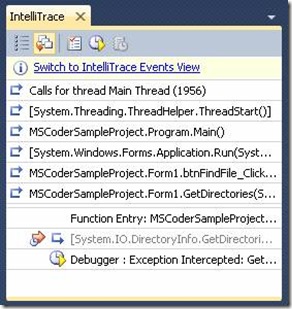
In IntelliTrace window option will be available to switch to Calls view.
Calls view will display all the calls to the method. When we double click on any call we can easily see the local variable, call stack of that moment when that call was made.
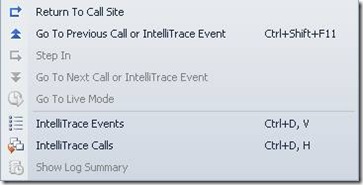
To navigate forward and backward we can use these commands which are available Under Debug menu
Debug -> IntelliTrace ->
As I mentioned earlier that it will create a file with extension “.iTraceâ€. We can open this file in Visual Studio and it will look like below image. It contains multiple sections like Threads list, Exception Data, System Information, Modules etc.
Happy Debugging ![]()
